Harmonograph
javascript code w. animation
http://andygiger.com/science/harmonograph/index.html
equations
http://www.walkingrandomly.com/?p=151
excel sheet
http://excelunusual.com/3-pendulum-harmonograph-an-improved-version/
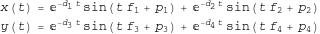
Andrew Purdam has produced equations that allow one to explore the beauty of the harmongraph without building one….not that building one is any less satisfying. His equations are:
x(t) = Ax(t) sin(wx t + px) + As(t) sin(ws t + ps)
y(t) = Ay(t) sin(wy t + py)
http://wabmo.com/Encyclogram/Harmonograph.htm
http://andygiger.com/science/harmonograph/index.html
Cundy, H. and Rollett, A. The Harmonograph, Mathematical Models, 3rd ed. Stradbroke, England: Tarquin Pub., pp. 244-248, 1989.
http://excelunusual.com/modeling-a-three-pendulum-harmonograph-%E2%80%93-tutorial-part-2/
http://excelunusual.com/wp-content/uploads/2011/01/Harmonograph_Tutorial_2.pdf
http://excelunusual.com/3-pendulum-harmonograph-an-improved-version/
http://www.wimp.com/three-pendulum-rotary-harmonograph/
How to Make a Three-Pendulum Rotary Harmonograph Karl Sims http://www.karlsims.com/harmonograph/
http://hackaday.com/2010/07/02/three-pendulum-harmonograph/
http://www.walkingrandomly.com/?p=151
https://www.youtube.com/watch?v=BG9e06IWAxE
https://3dprint.com/33329/3d-printed-harmonograph/
Harmonograph: A Visual Guide to the Mathematics of Music” by Anthony Ashton
https://processing.org/discourse//alpha/board_Programs_action_display_num_1100500605.html
walkingrandomly - Simulating Harmonographs
So how might we go about simulating a harmonograph? Well the motion of a single damped pendulum along the x axis can be described by the parametric equation
where t denotes time, p is a phase factor between 0 and 2*pi and d is the strength of the damping term. The larger you make d, the more quickly the pendulum oscillations will decay.
If we have two independent pendulums oscillating along the x-axis, both contributing to the overall motion of our pencil then, thanks to the principle of superposition, the total motion along the x-axis is given by

If we also have two pendulums oscillating along the y-axis then the final set of equations is
Now, if you search the internet you will find that other people have written down equations for harmonograph plots and you might find that they look slightly different to the ones I have written above but you should always be available to transform my equations into any other valid set. For example, the equations given in the website here describe a system with only three pendulums so simply cross out the second term for y(t) in my set of equations and you are almost done. You might also find that some people use Cosine instead of Sine – in which case you simply set the phase in my equations to be pi/2 since sin(x+pi/2) = cos(x).
Something else I have done is to assume that the initial amplitude of all of my pendulums is set to one. This is because I already have 12 parameters to play with which I think is more than enough for an initial play around.
As an aside, it turns out that these equations can describe much more than just Harmonographs. For example, by setting the damping factors to 0 and by crossing out the second term in each equation (thus only considering 2 oscillators) you will end up with Lissajous figures. With a bit of algebraic manipulation you can also obtain the equations that describe spirograph curves – see this link for the details.
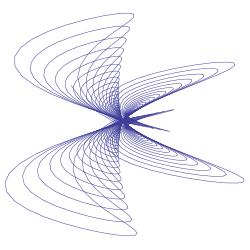
So, we have a set of parametric equations and we want to plot the result. In Mathematica the ParametricPlot command is what we need so let’s give our 12 parameters some numbers and see what we can come up with.
ParametricPlot[{Sin[2 t + Pi/16] Exp[- 0.02 t] + Sin[6 t + 3 Pi/2] Exp[-0.0315 t], Sin[1.002 t + 13 Pi/16] Exp[-0.02 t] + Sin[3 t + Pi] Exp[-0.02 t]}, {t, 0, 167}, PlotRange -> All, Axes -> None]
Parametric plots in Python
https://pypi.python.org/pypi/Fplot/0.1.1
Fplot’s goal is to provide simple syntax for plotting functions, with sensible defaults. Matplotlib is powerful, but has awkward syntax, odd default display settings, and requires setting up data arrays manually. Making pretty function plots requires multiple lines of code. Fplot aims to fix this; it’s especially suited for visualizing functions when learning math.
http://matplotlib.org/
http://www.numfocus.org/
http://www.users.globalnet.co.uk/~ngo/ast00800.htm A computer simulation of a harmonograph. William Overington
http://www.winton.org.uk/tcl/index.html Harmony simulates a twin-elliptical pendulum harmonograph. What’s that? Well, basically a machine for generating interesting patterns. Have try … you’ll be hooked ..